50+ Custom Symbols
Custom PI Vision Symbols
Enterprise-grade custom symbols designed specifically for AVEVA PI Vision. Each symbol is built for real-world industrial applications with high performance and seamless integration.
Featured
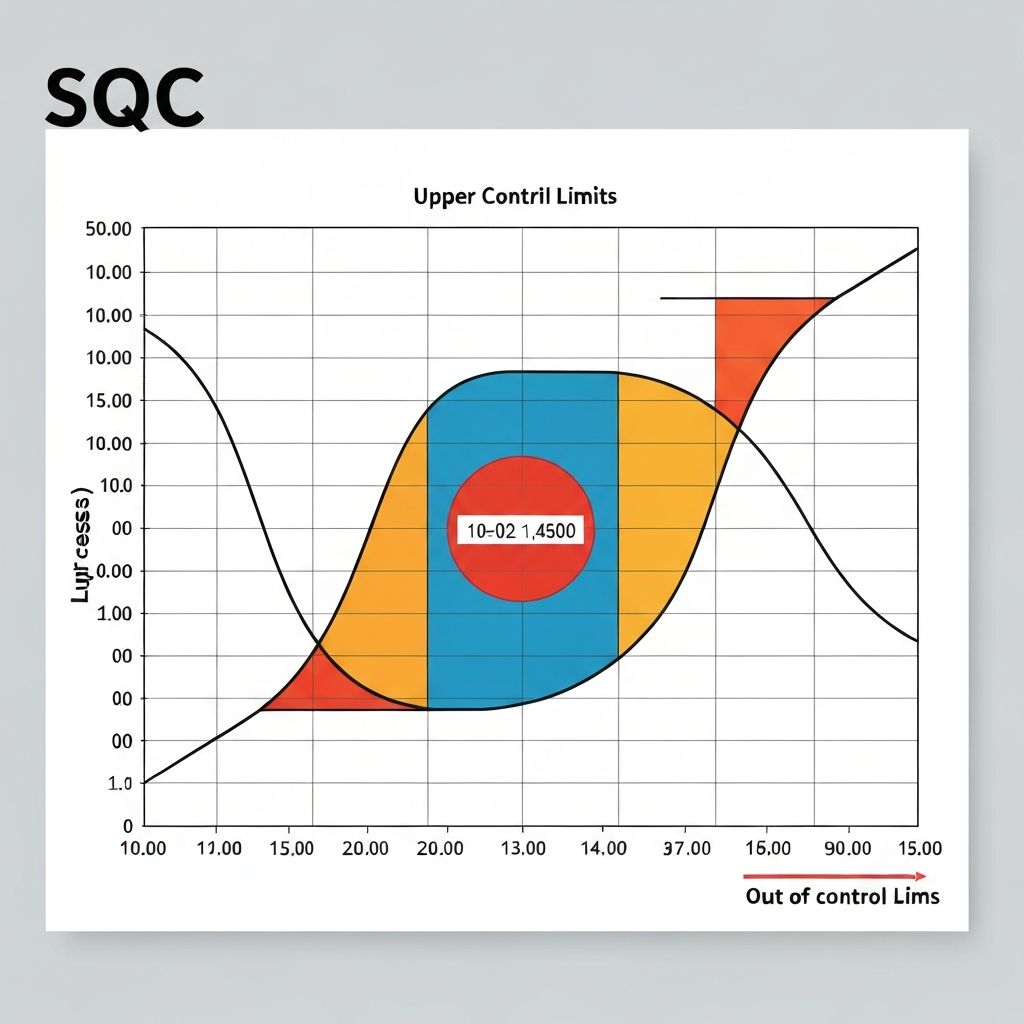
SQC Control Chart
Statistical Quality Control chart with UCL, LCL, and trend analysis for process monitoring.
QualityStatisticsControl Limits
Featured
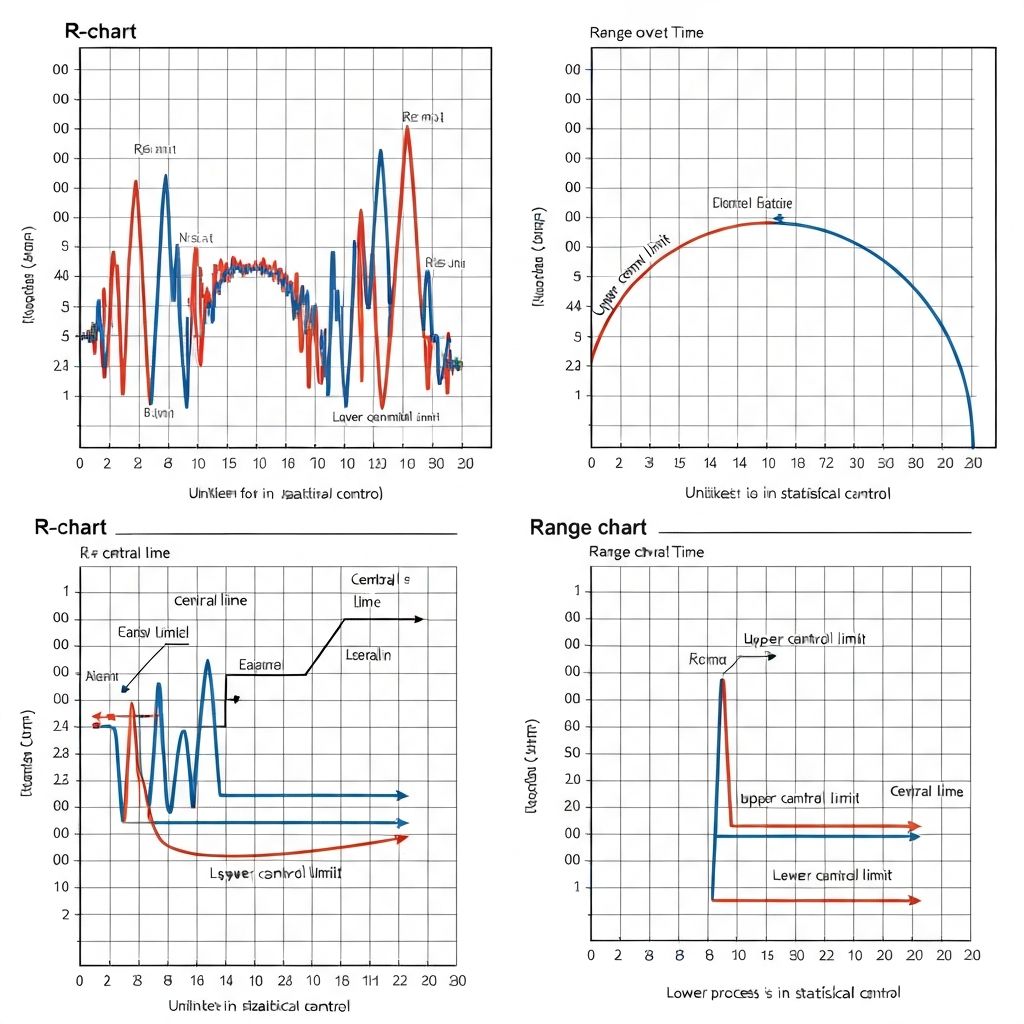
SQC Range Chart
R-chart for monitoring process variability and range statistics over time.
RangeVariabilityQuality
Featured
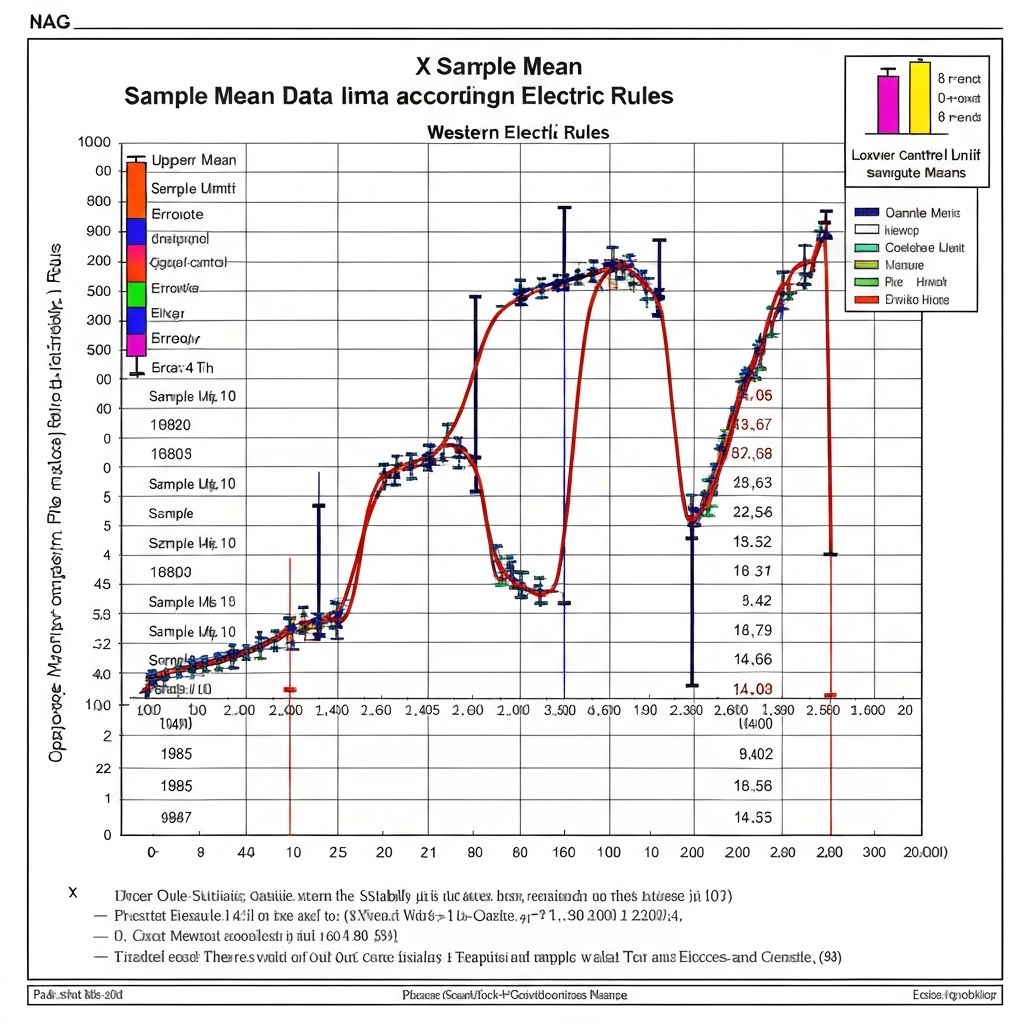
SQC X-bar Chart
X-bar chart for monitoring sample means with Western Electric rules.
MeanSamplesRules
Featured
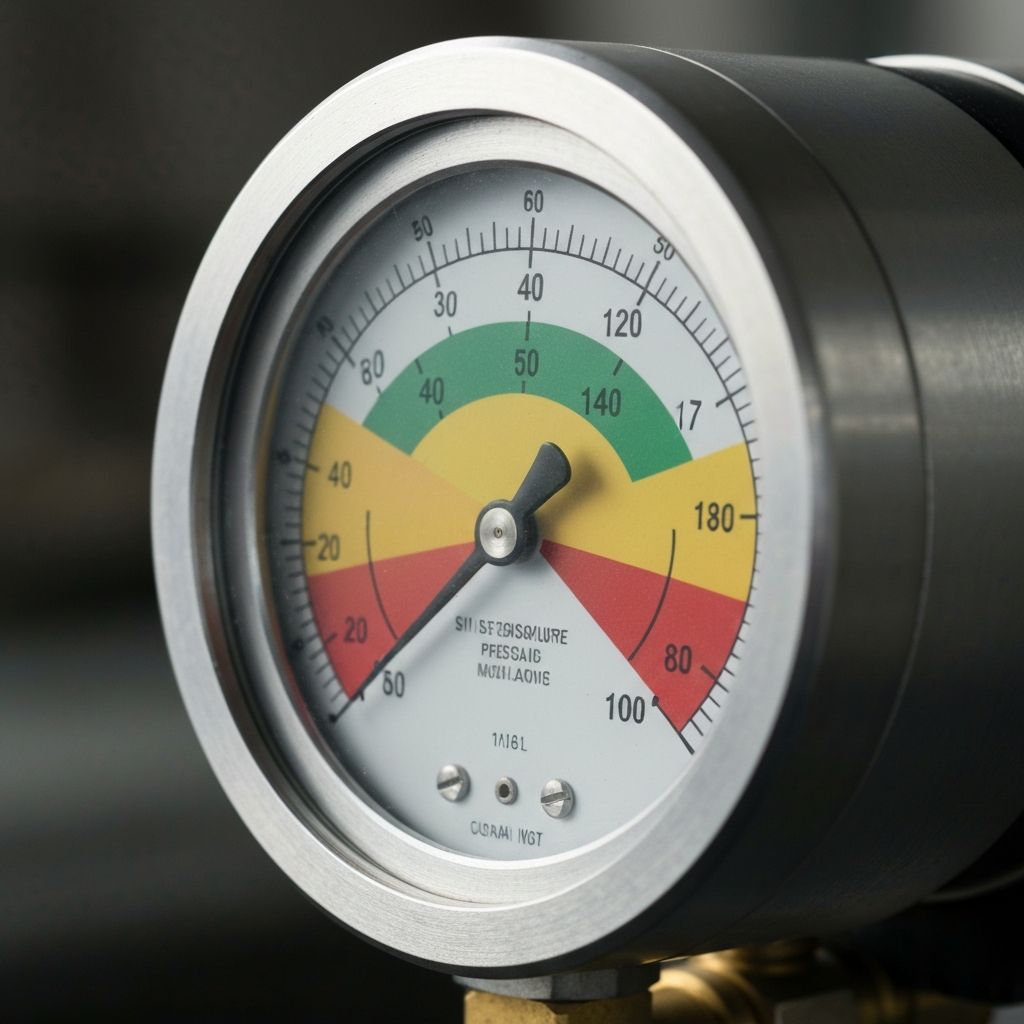
Radial Gauge
Customizable radial gauge with multiple ranges, color zones, and animated needle.
PressureTemperatureSpeed
Linear Gauge
Horizontal or vertical linear gauge with configurable scales and setpoints.
LevelFlowPercentage
Featured
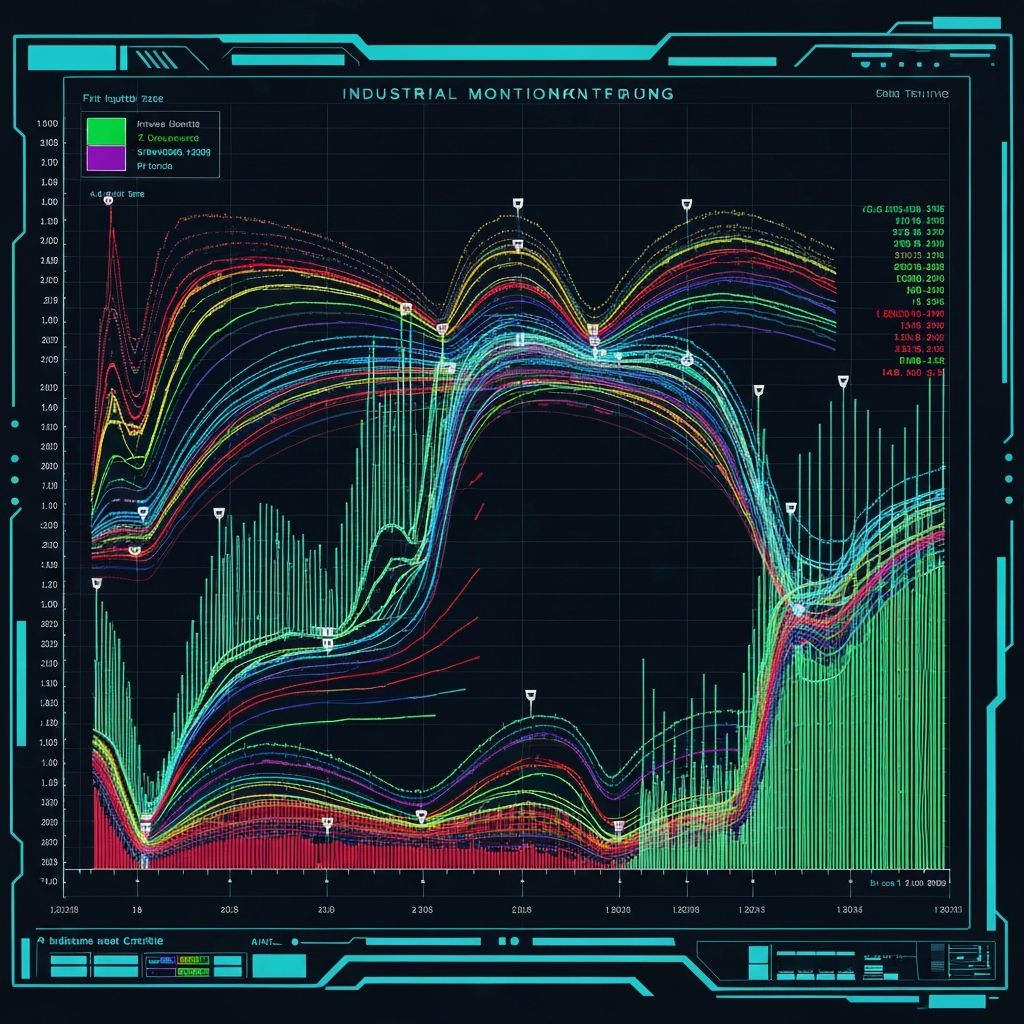
Multi-Trend Chart
Multi-axis trend chart supporting up to 8 simultaneous data streams with zoom.
TrendsHistoricalMulti-axis
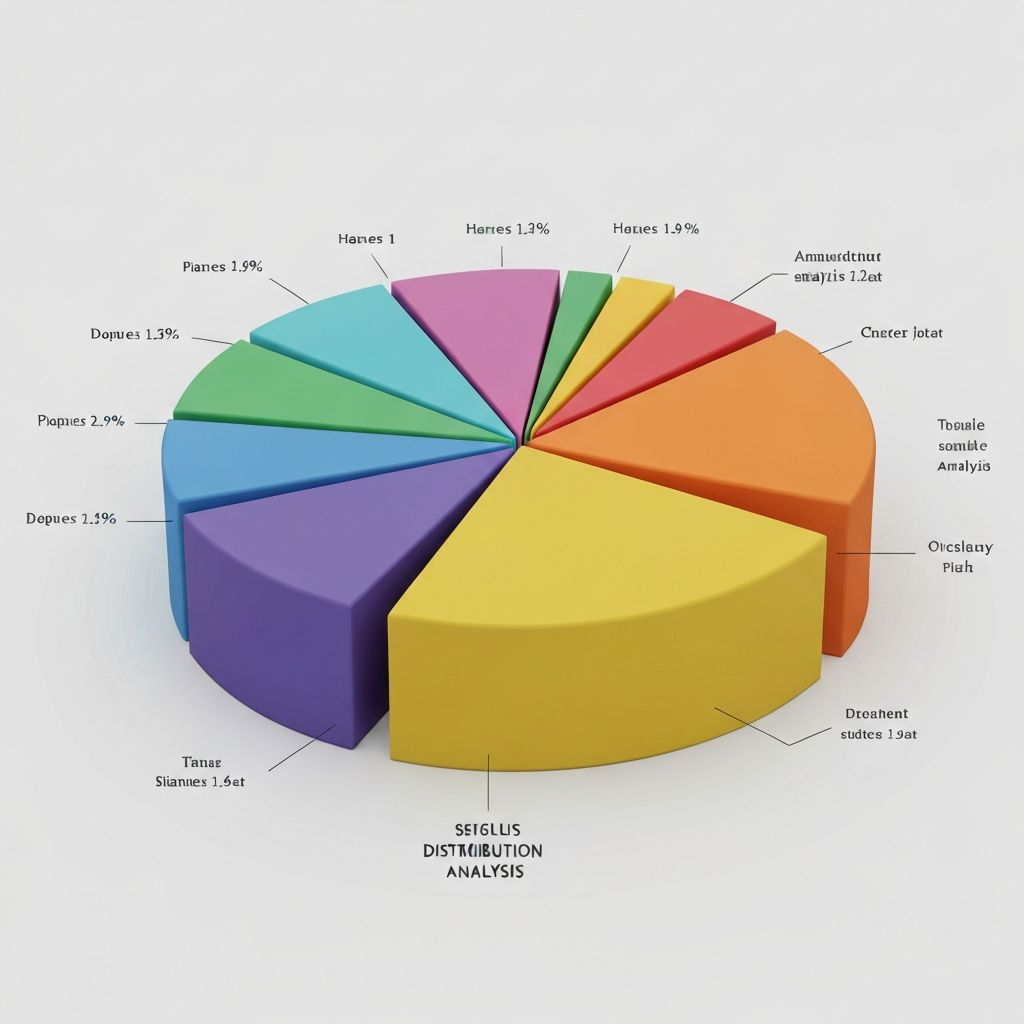
Pie Distribution
Interactive pie chart for showing distribution of values across categories.
DistributionCategoriesInteractive
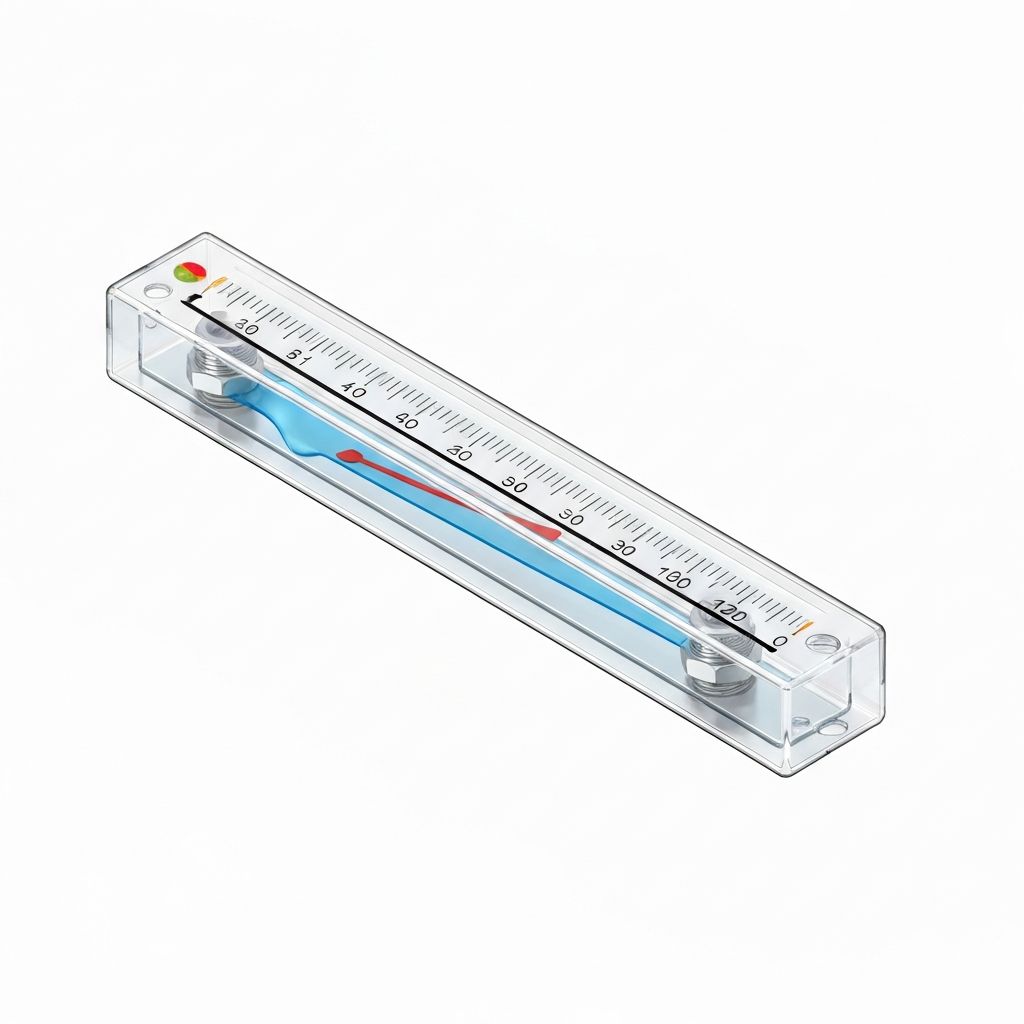
Temperature Monitor
Temperature visualization with thermometer display and alarm thresholds.
TemperatureAlarmsProcess
Featured
Flow Indicator
Animated flow indicator showing fluid movement direction and rate.
FlowLiquidAnimation
Pressure Display
Real-time pressure monitoring with trend sparkline and limit indicators.
PressureReal-timeLimits
Featured

Power Meter
Electrical power consumption meter with kW, kWh, and power factor display.
PowerEnergyElectrical
Runtime Counter
Equipment runtime counter with hours, minutes, and maintenance alerts.
RuntimeMaintenanceCounter
Featured
Alarm Status Panel
Multi-state alarm panel showing current, acknowledged, and historical alarms.
AlarmsStatusSafety
Equipment Status
Equipment state indicator with running, stopped, fault, and maintenance modes.
EquipmentStatusModes
Featured
OEE Dashboard
Overall Equipment Effectiveness dashboard with availability, performance, quality.
OEEPerformanceDashboard
Batch Tracker
Batch process tracking symbol with phase progress and recipe parameters.
BatchRecipeProgress
Data Router
Visual data routing symbol showing tag connections and data flow paths.
RoutingTagsConnections
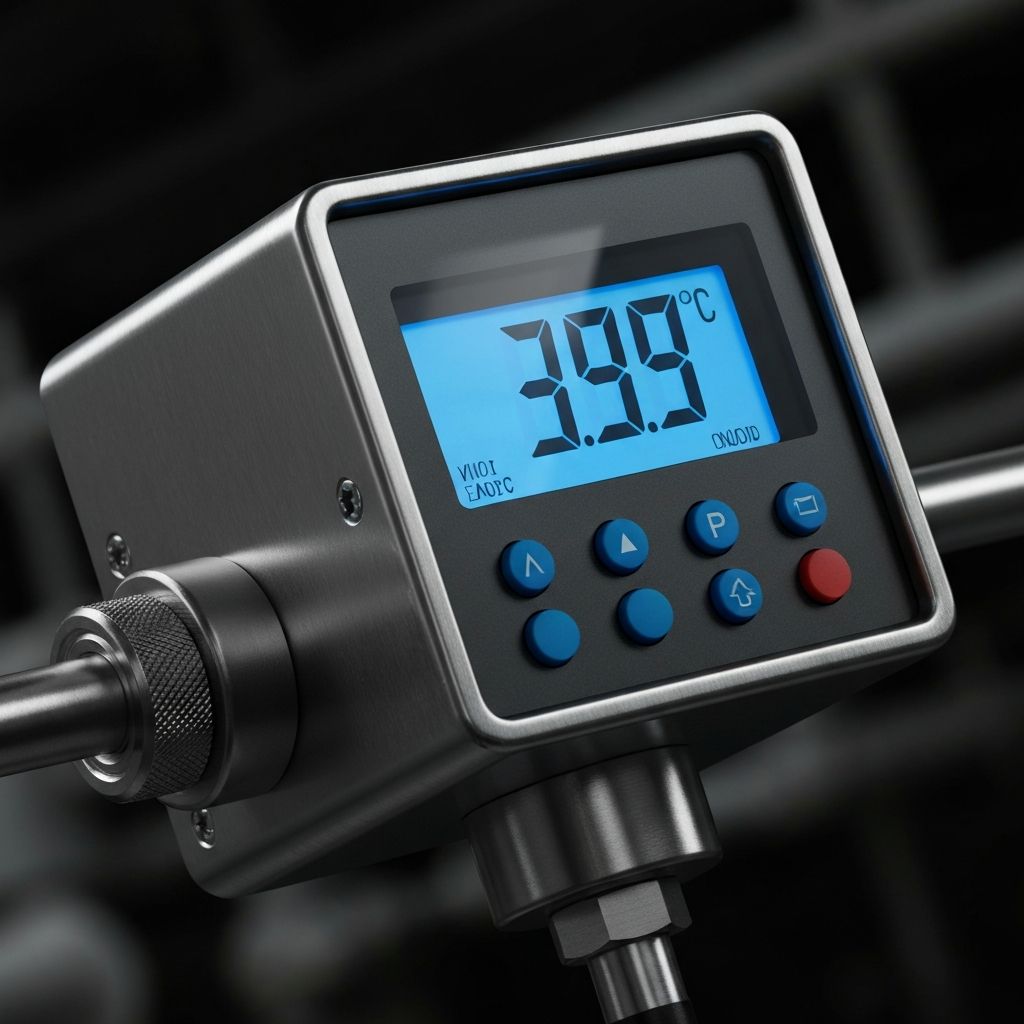
Digital Display
Seven-segment style digital display for numeric values with units.
DigitalNumericDisplay
Sparkline Trend
Compact sparkline trend for embedding in tables and dashboards.
SparklineCompactTrend
Featured
Pareto Chart
Pareto analysis chart for identifying key contributors to quality issues.
ParetoAnalysisQuality
Need a Custom Symbol?
Don't see what you need? We specialize in creating bespoke PI Vision symbols tailored to your specific industrial requirements.
Request Custom Symbol